Using Infographics to Simplify Complex Information and Encourage Sharing
Explanation & Implementation Guide
Explanation
Infographics are powerful visual tools that simplify complex data and information, making it easier for users to quickly understand concepts. These visually engaging elements help boost user engagement, encourage social sharing, and improve the user experience on your Shopify site. Infographics can be especially effective in SEO by increasing time spent on page and improving the likelihood of backlinks from other websites, all of which contribute to higher rankings. By presenting complex information in a digestible format, infographics also create opportunities for your content to be shared across social media platforms, further amplifying your website’s visibility and driving traffic.
Implementation Guide
Google Analytics:
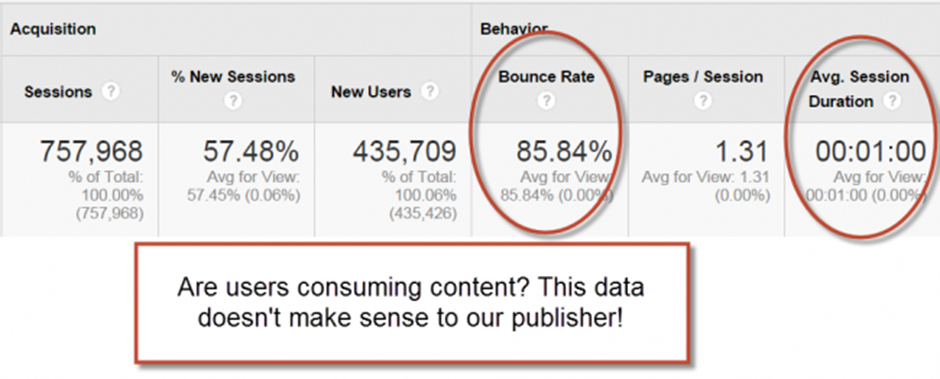
- Review engagement metrics such as time on page, bounce rate, and social shares for pages with and without infographics.
- Compare user behavior on these pages to identify any correlation between the presence of infographics and increased engagement or sharing.
- Use this data to determine whether infographics are enhancing the user experience and contributing to SEO efforts.

Shopify Apps:
- Install apps like Lucky Orange or Hotjar to track user interactions with infographics and other types of content.

- These tools provide heatmaps, click tracking, and scroll behavior data, which can help you evaluate the effectiveness of infographics in engaging visitors and encouraging them to share.
Fixing the Issue
Create High-Quality Infographics:
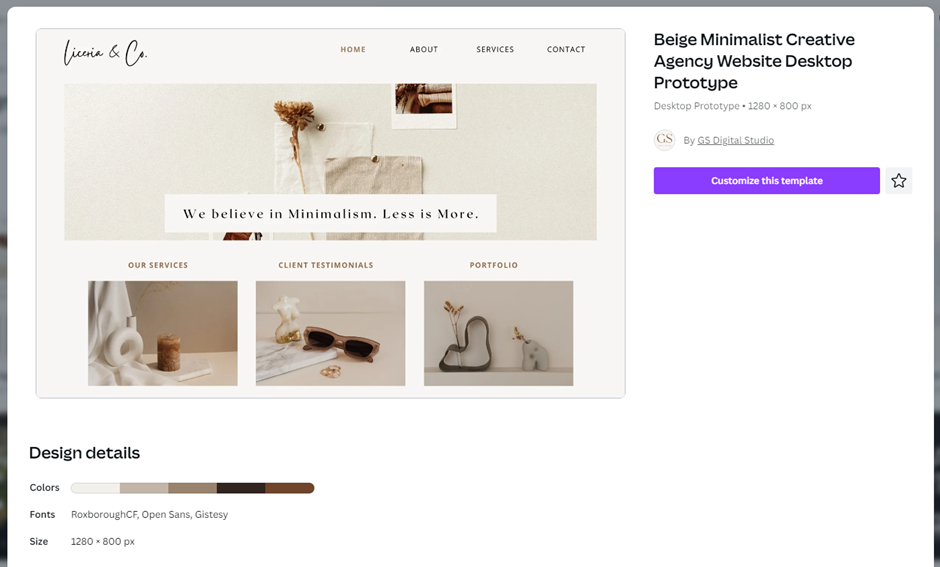
- Use graphic design tools like Canva, Adobe Illustrator, or Piktochart to design visually appealing and professional infographics.
- Ensure that your infographics clearly communicate complex information in an easy-to-understand and concise manner.
- Focus on clarity, simplicity, and relevance to your target audience to make sure the infographics add value and resonate with viewers.

Integrate Infographics into Content Strategy:
- Identify topics or concepts within your content that can be effectively represented using visuals.
- Incorporate infographics into blog posts, product pages, or other relevant areas of your website where they can enhance understanding and engagement.
- Ensure that infographics are used strategically to complement textual content and not replace it, creating a balanced approach to content presentation.

Promote Infographics for Sharing:
- Encourage users to share your infographics by including social sharing buttons or call-to-action prompts on the page.
- Share the infographics across your social media platforms to increase visibility and drive traffic.
- Share the infographics in relevant online communities, forums, and industry groups to further promote them and encourage organic sharing.
Track Performance and Iterate:
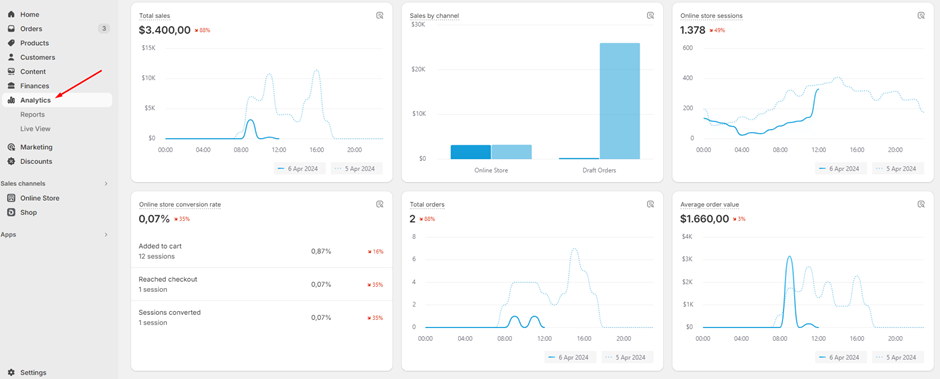
- Monitor the performance of your infographics using tools like Google Analytics or Shopify’s built-in analytics.
- Analyze engagement metrics such as views, shares, and time spent on the page to assess the success of each infographic.
- Collect feedback from users and refine your infographic strategy based on the insights gathered, improving the effectiveness of future infographics.

No comments to show.

Leave a Reply