Chrome Console Errors Check
Explanation & Implementation Guide
Explanation
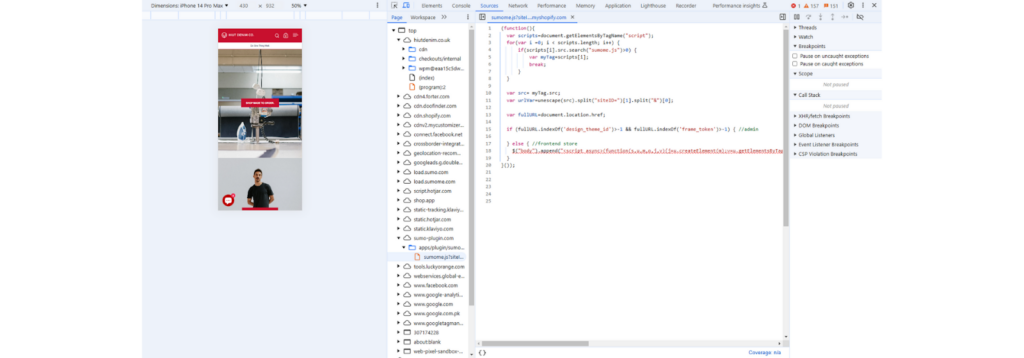
The DevTools Console in Google Chrome shows JavaScript errors, network issues, and other critical messages that may affect your website’s performance, user experience, and search engine visibility. Identifying and fixing these errors is essential for optimizing site functionality and SEO.
Implementation Guide
Identifying Console Errors:
Open Chrome DevTools: Navigate to your Shopify store in Google Chrome.
Right-click on the page and select Inspect, or press Ctrl+Shift+I (Windows) or Cmd+Opt+I (Mac) to open DevTools.
Click on the Console tab to view any errors or warnings.

Analyze the Errors:
- Look for messages in red (errors) or yellow (warnings).
- Take note of the error types: JavaScript errors, network issues, resource loading problems, etc.
Fixing the Issue
JavaScript Errors:
- Identify the script or feature causing the error.
- For third-party plugins, check for updates or contact the developer for support.
- For custom code errors, review the error message for clues and consult a developer if necessary.

Network Issues:
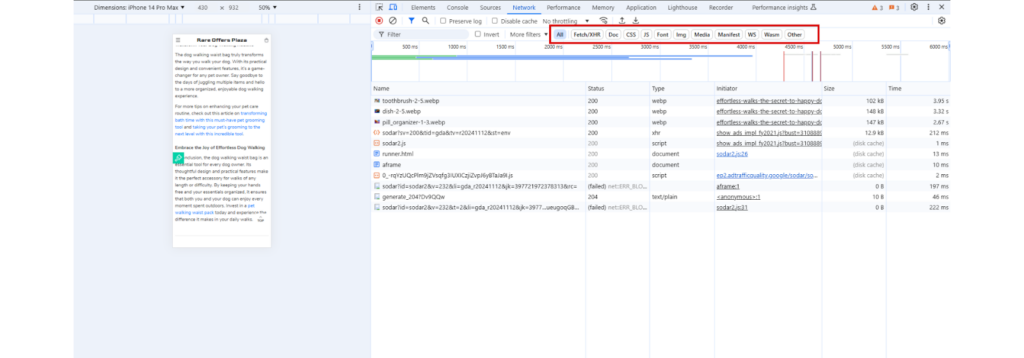
- Look for failed resource loads like missing images, CSS, or JavaScript files.
- Ensure file paths are correct and that the files exist on your server.
- Check for expired or incorrect SSL certificates if resources are being blocked.

Fixing Other Warnings and Errors:
- Address mixed content warnings by ensuring all resources are loaded over HTTPS.
- Update any outdated libraries or APIs causing compatibility issues.
Recheck Your Site
- After making changes, refresh your Shopify store with DevTools open to confirm the errors are resolved.
- Clear your browser cache or test in an incognito window to ensure the fixes are effective.

Regular Monitoring
Periodically use Chrome DevTools to check for new errors and resolve them before they negatively impact users and SEO.
No comments to show.

Leave a Reply